Reading an option chain is a critical skill for traders, providing a snapshot of available options for a stock or index, including strike prices, premiums, implied volatility (IV), open interest, and Greeks like delta and theta. To analyze it, select the underlying asset, choose the expiration date, review calls and puts, assess open interest and volume for liquidity, evaluate IV for pricing, and use Greeks to understand risk and reward. In 2025’s fast-moving markets, mastering option chain analysis helps traders identify high-probability setups, manage risks, and execute strategies like spreads or straddles with confidence, leveraging platforms like Thinkorswim or Interactive Brokers for real-time data.
What Is an Option Chain?
An option chain is a table displaying all available options contracts for a specific underlying asset (e.g., stock, ETF, or index) at various strike prices and expiration dates. It includes both calls and puts, showing key metrics like bid/ask prices, open interest, volume, implied volatility, and Greeks (delta, gamma, vega, theta).
Key Components of an Option Chain
Underlying Asset: The stock or index (e.g., Apple (AAPL), SPY).
Expiration Date: When the option expires (e.g., weekly, monthly, or LEAPS).
Strike Price: The price at which the option can be exercised.
Calls/Puts: Calls give the right to buy; puts give the right to sell.
Bid/Ask Prices: The price to buy (ask) or sell (bid) the option.
Open Interest: Number of outstanding contracts for a strike.
Volume: Number of contracts traded that day.
Implied Volatility (IV): Expected volatility affecting option prices.
Greeks: Metrics like delta (directional sensitivity), gamma (delta change), vega (IV sensitivity), and theta (time decay).
Why Read an Option Chain?
Liquidity Assessment: High open interest and volume indicate tight bid-ask spreads, easing trade execution.
Sentiment Analysis: High call/put open interest signals bullish/bearish sentiment.
Strategy Selection: Data guides choices for spreads, straddles, or hedges.
Risk Management: Greeks and IV help assess risk/reward.
Example: For NVDA at $120, an option chain shows a $125 call with 10,000 open interest and high volume, signaling liquidity for a bull call spread.
In 2025, with rapid market moves, option chains are critical for navigating volatility and spotting opportunities.
Step-by-Step Guide to Reading Option Chain Data
Follow these steps to analyze an option chain effectively, using a hypothetical example of Tesla (TSLA) at $350 in 2025.
Step 1: Select the Underlying Asset
Action: Choose the stock, ETF, or index (e.g., TSLA, SPY, NVDA) on your trading platform (e.g., Thinkorswim, Interactive Brokers).
Purpose: Focuses the chain on your target asset.
Example: Select TSLA on Thinkorswim to view its option chain.
Tip: Trade liquid assets like SPY or AAPL for tighter spreads and reliable data.
Step 2: Choose the Expiration Date
Action: Pick an expiration (e.g., weekly, monthly, or LEAPS) based on your strategy and time horizon.
Considerations:
Short-term (7–30 days): High theta, suitable for quick trades (e.g., straddles pre-earnings).
Medium-term (30–90 days): Balances theta and vega, ideal for spreads.
Long-term (LEAPS, 6–12 months): Lower theta, suited for hedging or directional bets.
Example: For a TSLA earnings play, select a 30-day expiration to capture IV spikes.
Tip: In 2025, use 30–45-day expirations for tech stocks to balance volatility and decay.
Step 3: Review Calls and Puts
Action: Examine the call and put sections, typically split on the chain, with strikes listed in the center.
Key Metrics:
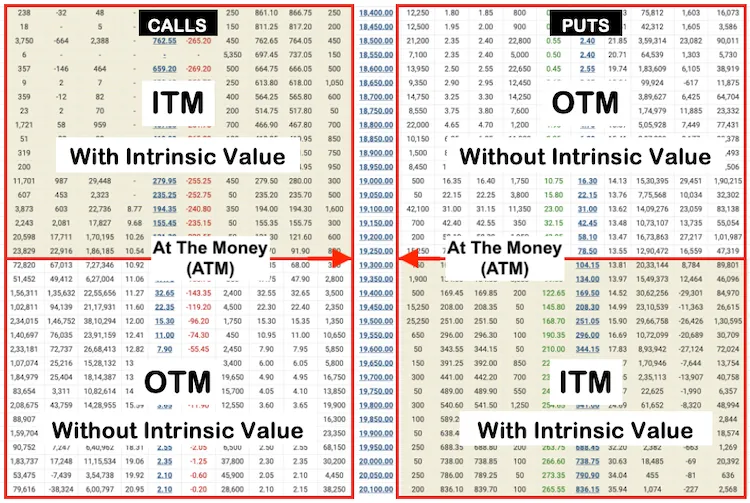
In-the-Money (ITM): Calls with strikes below stock price ($350); puts above. Higher delta (0.70–1.00), more expensive.
At-the-Money (ATM): Strikes near stock price ($350). Delta ~0.50, balanced cost.
Out-of-the-Money (OTM): Calls above $350; puts below. Lower delta (0.10–0.30), cheaper but riskier.
Example: For TSLA at $350, the $340 call is ITM (delta 0.70), $350 call is ATM (delta 0.50), $360 call is OTM (delta 0.30).
Tip: Focus on ATM or slightly OTM options for cost-effective strategies in volatile markets.
Step 4: Assess Open Interest and Volume
Action: Check open interest (outstanding contracts) and volume (daily trades) for liquidity.
Guidelines:
High Open Interest (>5,000): Indicates liquidity, tighter bid-ask spreads.
High Volume (>1,000): Confirms active trading, easing entry/exit.
Low Open Interest/Volume: Avoid due to wide spreads and slippage.
Example: TSLA $360 call has 15,000 open interest and 2,000 volume, signaling liquidity for a trade, while the $380 call has 200 open interest, risking illiquidity.
Tip: In 2025, prioritize strikes with >10,000 open interest for tech stocks to ensure execution.
Step 5: Evaluate Implied Volatility (IV)
Action: Analyze IV to assess option pricing and market expectations.
Key Points:
High IV (IVP > 80): Expensive options, ideal for selling (e.g., covered calls) but risky for buying due to potential IV crush.
Low IV (IVP < 20): Cheap options, ideal for buying (e.g., calls) to benefit from IV expansion.
IV Crush: Post-event (earnings, Fed), IV drops, reducing premiums.
Example: TSLA $350 call has 40% IV (IVP 85). Avoid buying pre-earnings; sell for premium or wait for IV drop.
Tip: Use Barchart to check IVP; buy when <20, sell when >80 in 2025’s volatile markets.
Step 6: Analyze the Greeks
Action: Use Greeks to understand risk/reward and inform trade decisions.
Key Greeks:
Delta: Measures price sensitivity (0–1 for calls, -1–0 for puts). High delta (0.70) for ITM options; low (0.20) for OTM.
Gamma: Rate of delta change; high for ATM options, signaling rapid price swings.
Vega: Sensitivity to IV changes; higher for longer-dated options.
Theta: Daily time decay; higher for short-dated ATM options.
Example: TSLA $350 call (30 days): delta 0.50, vega 0.30, theta -0.10. A $1 stock rise increases the option by $0.50; a 10% IV rise adds $3; daily decay costs $0.10.
Tip: Use Thinkorswim’s Greeks columns to filter for delta (0.40–0.60) for balanced trades.
Step 7: Identify Support and Resistance
Action: Use open interest to spot potential support (high put open interest) or resistance (high call open interest).
How It Works: High open interest at a strike suggests market makers defend it, creating price barriers.
Example: TSLA at $350 has 20,000 open interest in $340 puts (support) and 15,000 in $360 calls (resistance). Expect price to hover between $340–$360.
Tip: In 2025, use heatmaps on Barchart to visualize high open interest strikes.
Step 8: Select a Strategy
Action: Choose a strategy based on chain data and market outlook.
Examples:
Bullish: Buy ITM/ATM calls ($350 call, high delta) or bull call spread ($350 buy/$360 sell).
Bearish: Buy puts ($360 put) or bear put spread ($360 buy/$350 sell).
Neutral/Volatility: Straddle ($350 call + put) or iron condor ($340 put sell/$330 buy, $360 call sell/$370 buy).
Example: For TSLA, buy a $350 call ($5, delta 0.50) if bullish, with high open interest (15,000) and low IVP (20).
Tip: Match strategy to chain data (e.g., high open interest for spreads, low IV for buys).
Step 9: Monitor and Adjust
Action: Track the chain for changes in volume, open interest, IV, or Greeks to adjust or exit trades.
Guidelines:
Exit if delta drops below 0.30 (waning momentum).
Exit pre-event if IVP > 80 to avoid crush.
Roll options to a later expiration if viable within risk limits.
Example: If TSLA $350 call’s delta drops to 0.20 or IVP spikes to 90 pre-earnings, exit or roll to a $360 call next month.
Tip: Set daily alerts for delta and IV changes on your platform.
Practical Example: Reading TSLA’s Option Chain
Scenario: TSLA trades at $350 in October 2025, pre-earnings. You use Thinkorswim to analyze the chain.
Select TSLA: Open the option chain for TSLA.
Choose Expiration: Select 30-day expiration (November 2025) for an earnings play.
Review Calls/Puts: Note $340 call (ITM, delta 0.70, $12), $350 call (ATM, delta 0.50, $5), $360 call (OTM, delta 0.30, $2).
Check Open Interest/Volume: $350 call has 15,000 open interest, 2,000 volume; $360 call has 10,000 open interest, 1,500 volume. Both are liquid.
Evaluate IV: $350 call IV is 40% (IVP 85). High IV suggests selling or waiting for a drop.
Analyze Greeks: $350 call: delta 0.50, vega 0.30, theta -0.10. Expect $0.50 move per $1 stock change, $3 gain per 10% IV rise, $0.10 daily decay.
Identify Support/Resistance: 20,000 open interest in $340 puts (support); 15,000 in $360 calls (resistance).
Select Strategy: Sell a $360 call ($2) for premium, expecting IV crush post-earnings, risking 1% of a $10,000 account ($100).
Monitor: Exit if IVP drops to 20 post-earnings or delta rises to 0.50, locking in profits.
Outcome: TSLA stays at $355 post-earnings, IV drops to 20%, call falls to $0.50, yielding $1.50 profit ($150 per contract).
Tools and Resources for Reading Option Chains
In 2025, leverage these tools to analyze chains:
Trading Platforms
Thinkorswim: Real-time chains with Greeks, open interest, and IV; customizable filters.
Interactive Brokers: Detailed chains with automated alerts for delta/IV.
Tastytrade: User-friendly chains for strategy planning.
Analytical Tools
OptionStrat: Visualizes chain data and strategy outcomes.
Barchart: Heatmaps for open interest and IVP tracking.
CBOE Calculators: Free Greek and IV analysis.
Data Sources
Yahoo Finance: Tracks earnings/Fed events affecting IV.
Bloomberg: Real-time chain data for stocks and ETFs.
X Platform: Follow vetted traders for chain insights (avoid hype).
Educational Resources
Options as a Strategic Investment by Lawrence McMillan for chain analysis.
Udemy/Coursera courses on options data.
X communities for real-time chain discussions (vet for credibility).
Actionable Tip: Use Thinkorswim’s “Option Chain” tab to filter for high open interest (>5,000) and delta (0.40–0.60) strikes.
Common Pitfalls to Avoid
Ignoring Liquidity
Issue: Trading low open interest/volume strikes leads to wide spreads.
Solution: Choose strikes with >5,000 open interest, >1,000 volume.
Misreading IV
Issue: Buying high-IV options risks crush losses.
Solution: Check IVP; buy when <20, sell when >80.
Overcomplicating Greeks
Issue: Overwhelm from gamma/vega analysis.
Solution: Focus on delta and theta for beginners; add vega later.
Chasing Hype
Issue: X-driven trades ignore chain data.
Solution: Stick to plan criteria (e.g., IVP, open interest).
Static Analysis
Issue: Failing to monitor chain changes.
Solution: Check daily for IV, delta, or open interest shifts.
Example: A trader buys a TSLA $380 call with 200 open interest, losing $200 due to wide spreads. Switching to a $360 call (10,000 open interest) saves $100.
Advanced Techniques for Option Chain Analysis
1. Put-Call Ratio
Calculate total put open interest ÷ call open interest. Ratio >1 signals bearish sentiment; <1, bullish.
Example: TSLA’s put-call ratio of 1.5 (high put open interest) suggests hedging, prompting a protective put.
2. Delta-Neutral Analysis
Identify strikes with delta ~0.50 for balanced straddles or spreads.
Example: TSLA $350 call/put (delta 0.50) for a straddle, leveraging high open interest.
3. IV Skew
Compare IV across strikes. Higher IV in OTM puts vs. calls signals bearish sentiment.
Example: TSLA $340 put IV (45%) vs. $360 call (35%) suggests downside protection demand.
4. Rolling Strategies
Use chain data to roll losing trades to a later expiration or different strike.
Example: Roll a $350 TSLA call to $360 next month if delta < 0.30, based on chain liquidity.
Actionable Tip: Use Barchart’s IV skew charts to spot sentiment shifts.
Option Chains in 2025’s Markets
In 2025, tailor chain analysis to:
Tech Volatility: High IV in NVDA options requires IVP checks.
Crypto ETFs: Bitcoin ETF chains show high open interest in OTM strikes, signaling speculation.
Economic Events: SPX chains spike in volume pre-Fed announcements, guiding hedging.
Example: For NVDA at $120, select a $125 call spread with >10,000 open interest, IVP < 20, and delta 0.40–0.60 for a balanced trade.
Conclusion: Mastering Option Chain Analysis
Reading an option chain is a vital skill for option traders, unlocking insights into liquidity, sentiment, and risk. By selecting the right asset, expiration, and strikes, assessing open interest, IV, and Greeks, and choosing data-driven strategies, you can navigate 2025’s volatile markets with precision. Use platforms like Thinkorswim, practice in a demo account, and monitor chain changes to stay ahead. The top 5% of traders leverage option chains to make informed decisions—make this skill your edge for consistent profitability.